
Horizontal Bar Graphs with the ILM-216L
(ILM-216L has been discontinued for many years; reference only.)
Bar graphs provide a quick visual indication of relative values like battery charge, signal strength, control setting, etc. Although alphanumeric LCDs like the ILM-216L lack the ability to plot points or draw lines, their custom-characters can be used as building blocks for visually appealing bar graphs. This app note shows how, using a Parallax BASIC Stamp II as the host computer.
The principles demonstrated here can be used with any alphanumeric or graphics LCD that supports custom characters. However, the ILM-216's ability to store custom characters in EEPROM makes it particularly attractive for this application, since the controller is spared from having to store and download the characters itself.
Horizontal Bar Graphs on Text LCDs
The simplest bar graph you can generate with an alphanumeric LCD is a row of repeating characters. For example, a series of X's could represent a quantity. On a 16-column-wide display:
| x | value= 1 |
| xxxxxxxx | value= 8 |
| xxxxxxxxxxxxxxxx | value=16 |
For a more graphical presentation, a block character could be substituted for X's. for example, on most LCDs, ASCII 255 is a 5x8-pixel black rectangle
This approach limits the graph's resolution--the minimum change that can be depicted is 1 part in 16.
You can increase the resolution by using the LCD's set of 8 custom characters. Each character block is 5 pixels wide, so in principle you could break a 16-column display into 5 x 16 = 80 columns of pixels.
The problem here is that there are fixed, 1-pixel gaps between each character position. As a changing bar graph crosses a gap, it lurches 2 pixel spaces for a 1-unit change. This is disconcerting in dynamic bar graphs, making smooth changes appear jerky.
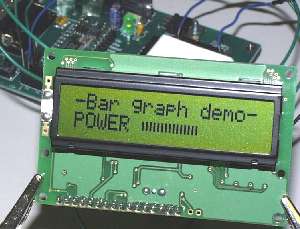
A nice compromise is to use every other pixel column so that each character position represents 3 units. This matches up with the gaps between character positions and creates an nifty, striped bar, as shown below. (Note that the on-screen displays in TVs universally use a similar striped bar, perhaps to emphasize changes as opposed to absolute quantity.)
With 3 units per character block, our 16-column-wide LCD can depict values from 0 to 48 (assuming that the full screen width is used; in the example here it isn't).
Configuring the ILM-216
Our ILM-216L serial LCDs can store 6 custom characters in EEPROM. Using free software, you can edit and download your own set of custom symbols, plus other startup settings.
To simplify our bar-graph program, we created the necessary custom characters and downloaded them into the ILM-216's EEPROM. Although the program could have been written to have the BASIC Stamp II download the custom characters at startup, using the ILM-216's EEPROM saves perhaps 100 bytes (5% worth) of BS2 program memory.
 If you plan to run the demo program,
download the software and the configuration file. Use the software
to load the config file into the ILM-216
before running the program. (To avoid retyping the program, just cut and paste
it from this page into a BS2 editor window.)
If you plan to run the demo program,
download the software and the configuration file. Use the software
to load the config file into the ILM-216
before running the program. (To avoid retyping the program, just cut and paste
it from this page into a BS2 editor window.)
Hookup for Demo
The schematic at right shows how to connect the display to the BS2 for the demo. Data for the graph comes from the pot/capacitor hookup shown. If you want to omit the pot, you may, but you will have to work out some other way to supply data to the bar-graph routine.
Running the BS2 Program
The BS2 program is listed below. Comments explain most of the
mechanics of it. It makes generous use of a lesser-known features
of the BS2 Serout instruction, the REP
(repeat) modifier.
Within a Serout list (inside the square brackets
[...]), REP causes a particular byte to be sent
repeatedly. For example,
serout pin,baudmode,[REP "X" \26]
..causes 26 Xs to be sent. A couple handy aspects of REP are that..
- The number of reps can be a variable.
- If the number of reps is 0, nothing is sent.
In our bar-graph application, we divide the value to be graphed by 3 (the max number of vertical bars in a single character position), and print that number of 3-bar character blocks (|||). Then we take the remainder of division by 3 and print the appropriate bar block (| for one, or || for two). The rest of the bar-graph width gets filled with blank spaces.
' Program: HGRAF1.BS2 (Horizontal bar graphs for BS2/ILM-216)
' This program demonstrates how to generate horizontal bar
' graphs with the BASIC Stamp 2 controller and ILM-216
' smart serial LCD module (www.seetron.com). Before running
' this program, the ILM-216 must be configured with the
' bar-graph symbols using the download/config utility
' (www.seetron.com/ilmwin.zip). The config file to use
' is www.seetron.com/hbar1.ilm. This file loads the
' custom characters and sets the ILM to 9600 baud.

' ==ILM-216 CONTROL CONSTANTS==========================
N9600   con     $4054   ' BS2 baudmode constant, 9600 bps.
S_PIN   con     0       ' Serout pin to ILM-216.
CLRLCD  con     12      ' ASCII form feed = clear screen.
CTL_P   con     16      ' Control-P (position cursor).

' ==BAR-GRAPH CONSTANTS================================
WIDTH   con     10              ' Max width in characters of bar.
MAXBAR  con     width * 3       ' Max bar counts.
FULBAR  con     131             ' ASCII value of ||| bar.
BASBAR  con     128             ' ASCII value of 0 bar (blank).

' ==PROGRAM VARIABLES==================================
graf    var     word    ' Value to be graphed.
bars    var     byte    ' Number of full ||| bars to draw.
bal     var     byte    ' Balance left after all |||s drawn.
pad     var     byte    ' Number of spaces to pad to fill width.
balF    var     bit     ' Is a 'bal' character needed? (1=yes, 0=no).

' ==DEMO PROGRAM=======================================
pause 1000      ' Wait for LCD to initialize.
serout S_PIN,N9600,[CLRLCD,"-Bar graph demo-",CTL_P,80,"POWER"]

Again:
  gosub getPotVal                       ' Sample the pot.
  serout S_PIN,N9600,[CTL_P,86] ' Move to pos 22 (64+22 =86).
  gosub barGraph                        ' Display bar graph.
goto Again                              ' Do it continuously.


' ==SUBROUTINES========================================
' BARGRAPH: Take the value in 'graf' and present it as a
' horizontal bar graph from the current cursor location with a
' total width (in characters) set by the WIDTH constant. Each
' character position can represent a maximum value of 3 using
' the FULBAR character |||. The routine calculates how many full
' bars to use by dividing by 3. If there's a remainder after
' dividing by 3, the routine tacks on a partial-bar character
' ( | or ||) to represent the balance('bal'). Finally, it pads
' the remainder of the bar width with blank spaces in order to
' erase any leftovers from previous graphs.
barGraph:
  bars = (graf max MAXBAR)/3    ' One full bar for each 3 graph units.
  bal = (graf max MAXBAR) // 3  ' Bal is remainder after division by 3.
  balF = bal max 1                      ' If bal <> 0 then balF=1.
  pad = WIDTH - (bars+balF)     ' Number of spaces to fill bar width.
  serout S_PIN,N9600,[rep FULBAR \bars, rep (bal+BASBAR) \balF, rep " " \pad]
return

' GETPOTVAL: For demo data, take a pot measurement through pin 1. Cap is
' 0.1uF to +5V; pot is 10k to ground, as shown in BS2 manual RCTIME entry.
getPotVal:              ' Output pot value
  high 1: pause 1       ' Discharge cap on pin 1.
  rctime 1,1,graf       ' Measure charge time (approx. 0-600)
  graf = graf/14        ' Scale to 0-50 approx.
return
Summary and Modifications
Modifying the bar-graph code is pretty straightforward. First, set the constant WIDTH at the beginning of the program to the maximum width (in characters) that you want the bar to cover. The maximum value that the bar can display will be 3x WIDTH.
Before a GOSUB barGraph, make sure to position the
cursor to the desired starting position on the LCD screen. It's
probably obvious, but that position should be WIDTH or more
characters from the right-hand edge of the screen, or the bar-graph
will wrap around.
Finally, put the value you want to graph into the variable
graf and GOSUB barGraph. After the bar
graph has been generated, the cursor will be in the next character
position after the end of the graph.
The bar graph can be updated pretty rapidly for a nice, animated effect. It's a good idea to turn off the visible cursor when the bar graph is displayed, since the blinking effects and/or ghost images of the rapidly moving cursor can be distracting.