
Animated Strip Plot with SGX-120L Displays
(SGX-120L has been discontinued for many years; reference only.)
A chart recorder is a relative of the oscilloscope that plots a value over time. This kind of graph gives you one-glance insight into the recent history and current trends of a changing value. You can easily implement a digital chart recorder or strip plot with the SGX-120L serial graphics LCD and a Parallax BASIC Stamp II This app note shows how.
Moving x/y Line Plot on Graphics LCDs
Since the SGX displays have built-in instructions for drawing lines (line and line-to), it's easy to write a program that plots a static x/y line graph of a set of data. Just scale the x and y data to fit the display screen, and draw lines between the x/y coordinates. Connect the dots.
To create a plot that updates continuously in real time we need a way to erase old data and replace it with new. The technique we're going to demonstrate uses a vertical line to erase one column of old data just before plotting new data.
The effect looks like an analog oscilloscope set to a slow scan rate or an EKG. See the photo below. The break in the middle of the plot is the point at which the vertical erase line is moving across the screen. Our demo program scans the screen width in about 3 seconds.
| Data plot sweeps rapidly across the display, erasing the oldest point and replacing it with the newest. The break in the middle of this plot is the leading edge of the data. | 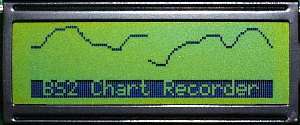 |
This kind of plot does not require processor-intensive tricks like horizonal scrolling of the display screen. A more subtle benefit is that it leaves the history of the data on-screen and stationary long enough to study it.
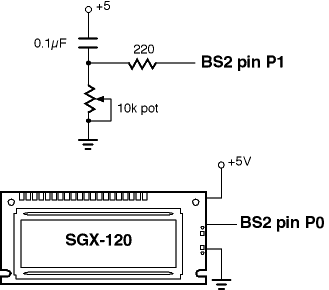
Hookup for Demo
The schematic at right shows how to connect the display to the BS2 for the demo. Data for the graph comes from the pot/capacitor hookup shown. If you want to omit the pot, you may, but you will have to work out some other way to supply data to the bar-graph routine.
Running the BS2 Program
The BS2 program is listed below. Comments explain most of the mechanics of it. Run the program and wiggle the pot to see the strip plot change.
' Program: SGXPLOT1.BS2 (Plot graphs with BS2/SGX-120L)
' This program demonstrates how to create an animated
' chart-recorder-style graph on the SGX-120L serial
' graphics LCD. The display is in the style of medical
' equipment, which leave old data stationary on the screen,
' incrementally erasing it as new data is plotted. This
' approach is efficient and easy on the eyes. For the
' demo, our data comes from a pot--twiddle the pot to
' see the graph change.

' Set the SGX-120L for 9600 bps and connect its serial input
' to BS2 pin P0. Connect a 10k pot/0.1uF cap to pin P1 as
' shown in the schematic (or in Stamp manual under RCTIME).

' ==SGX-120L CONTROL CONSTANTS=========================
N9600   con     $4054   ' BS2 baudmode constant, 9600 bps.
S_PIN   con     0       ' Serout pin to SGX-120L.
CLRLCD  con     12      ' ASCII form feed = clear screen.
CTL_P   con     16      ' Control-P (position cursor).
CTL_B   con     2       ' Start inverse-video print.
CTL_C   con     3       ' End   "             "
CUT0    con     64      ' 1-byte shortcut for 0.
ESC     con     27      ' Escape (begins graphics instruction).

' ==CHART CONSTANTS====================================
' You can change HEIGHT, WIDTH, and PCOLOR to modify the
' plot display. Try changing PCOLOR to WHITE for an
' inverse-video look.
BLACK   con     1       ' Black pixel-ink.
WHITE   con     0       ' White (background color) pixel-ink.
HEIGHT  con     22      ' Max Y val of plotting area.
WIDTH   con     120     ' Width of the plotting area.
PCOLOR  con     BLACK   ' Color of the plot.
ECOLOR  con     PCOLOR ^ 1      ' Erase color (opposite of PCOLOR).

' ==PROGRAM VARIABLES==================================
new     var     word    ' New value to be plotted.
old     var     byte    ' Previous plot value.
xOld    var     byte    ' Previous X-axis location.
xNew    var     byte    ' New X-axis location.

' ==DEMO PROGRAM=======================================
pause 1000      ' Wait for LCD to initialize.
' Send some dummy data to finish pending instructions (in case
' BS2 is reset while program is running), then clear screen.
serout S_PIN,N9600,[CUT0,CUT0,CUT0,CUT0,CLRLCD]
' Move to screen position 60 (4th line, 1st character) and
' print label in inverse video.
serout S_PIN,N9600,[CTL_P,124,CTL_B," BS2 Chart Recorder ",CTL_C]

Again:
 gosub getPotVal        ' Get the data.
 gosub plotChart        ' Plot it.
goto Again              ' Do it continuously.

' ==SUBROUTINES========================================
' PLOTCHART: Plot the current value of the variable 'new'.
' First, draw a vertical line in the ECOLOR (erase-color) at the
' current x position to erase any old data. Next set the PCOLOR
' (plot color) and draw a line from the old x/y position to the
' new x/y position. If we're wrapping around from the right-hand
' end of the graph, make xOld 0 to avoid drawing a 'retrace' line
' from right to left [xOld = xOld // (WIDTH-1)]. Finally, save
' the new x/y values as old for the next trip.
plotChart:
  new = HEIGHT - (new max HEIGHT)       ' Subtract to flip (higher values at top).
  xNew = xNew + 1 // WIDTH
  serout S_PIN,N9600,[ESC,"I",(CUT0+ECOLOR)]
  serout S_PIN,N9600,[ESC,"L",(xNew+CUT0),(CUT0),(xNew+CUT0),(CUT0+HEIGHT)]
  xOld = xOld // (WIDTH-1)
  serout S_PIN,N9600,[ESC,"I",(CUT0+PCOLOR)]
  serout S_PIN,N9600,[ESC,"L",(xOld+CUT0),(old+CUT0),(xNew+CUT0),(new+CUT0)]
  old = new
  xOld = xNew
return

' GETPOTVAL: For demo data, take a pot measurement through pin 1. Cap is
' 0.1uF to +5V; pot is 10k to ground, as shown in BS2 manual RCTIME entry.
getPotVal:              ' Output pot value
  high 1: pause 1       ' Discharge cap on pin 1.
  rctime 1,1,new        ' Measure charge time (approx. 0-600)
  new = new/20  ' Scale to 0-30 approx.
return
Summary and Modifications
Modifying the code is straightforward. You can change the width, height, and line color of the graph by changing the corresponding constants at the beginning of the program.
As written, the program scans the full width of the display in 3-4 seconds (plotting about 30 samples/second) The scan time is approximate, in part because it is influenced by RCTIME. You can modify the program for different scanning rate by inserting a delay (PAUSE) with the main program loop. Keep in mind that this kind of strip plot relies on the motion of the advancing plot line as a visual clue as to the newest data point. It's most effective at 1 sample/second or faster. At slower rates, you may want to add some feature to indicate where the newest data point is being plotted.